The data I am using is originally from SwedBank and all data and code is available at GitLab. The data contains interest rates at 5 years fixed term, 2 years fixed term, and 3 months fixed term (also called variable rate in Sweden) for those dates when any rate was changed. The first rates are from 1989-11-01 and the last are from 2018-02-12. Example of the data:
| 5y | 2y | 3m | |
|---|---|---|---|
| Date | |||
| 1989-11-22 | 13.50 | 13.50 | 12.75 |
| 1991-01-14 | 14.00 | 14.75 | 15.25 |
| 1993-01-13 | 12.75 | 13.00 | 13.75 |
| 1994-11-21 | 11.75 | 11.50 | 9.75 |
| 1996-03-12 | 9.85 | 8.95 | 9.10 |
| 2005-09-09 | 3.55 | 2.97 | 3.15 |
| 2005-10-03 | 3.69 | 3.09 | 3.15 |
| 2007-12-21 | 5.36 | 5.25 | 5.15 |
| 2008-01-24 | 5.13 | 4.94 | 5.15 |
| 2009-03-20 | 4.26 | 2.83 | 2.20 |
To make the calculations more convenient I assume that loans are only fixed the first day of the month. Example:
| 5y | 2y | 3m | |
|---|---|---|---|
| Date | |||
| 1990-06-01 | 14.50 | 14.50 | 13.95 |
| 1992-03-01 | 12.50 | 13.00 | 14.75 |
| 1993-06-01 | 10.75 | 10.50 | 11.50 |
| 1998-02-01 | 6.70 | 6.40 | 5.80 |
| 2001-09-01 | 6.55 | 5.95 | 5.90 |
| 2004-11-01 | 4.85 | 3.90 | 3.65 |
| 2009-05-01 | 4.15 | 2.73 | 1.97 |
| 2010-08-01 | 3.99 | 2.90 | 2.17 |
| 2011-05-01 | 5.29 | 4.39 | 3.88 |
| 2011-11-01 | 4.59 | 4.14 | 4.35 |
If we graph the interest rates we get:
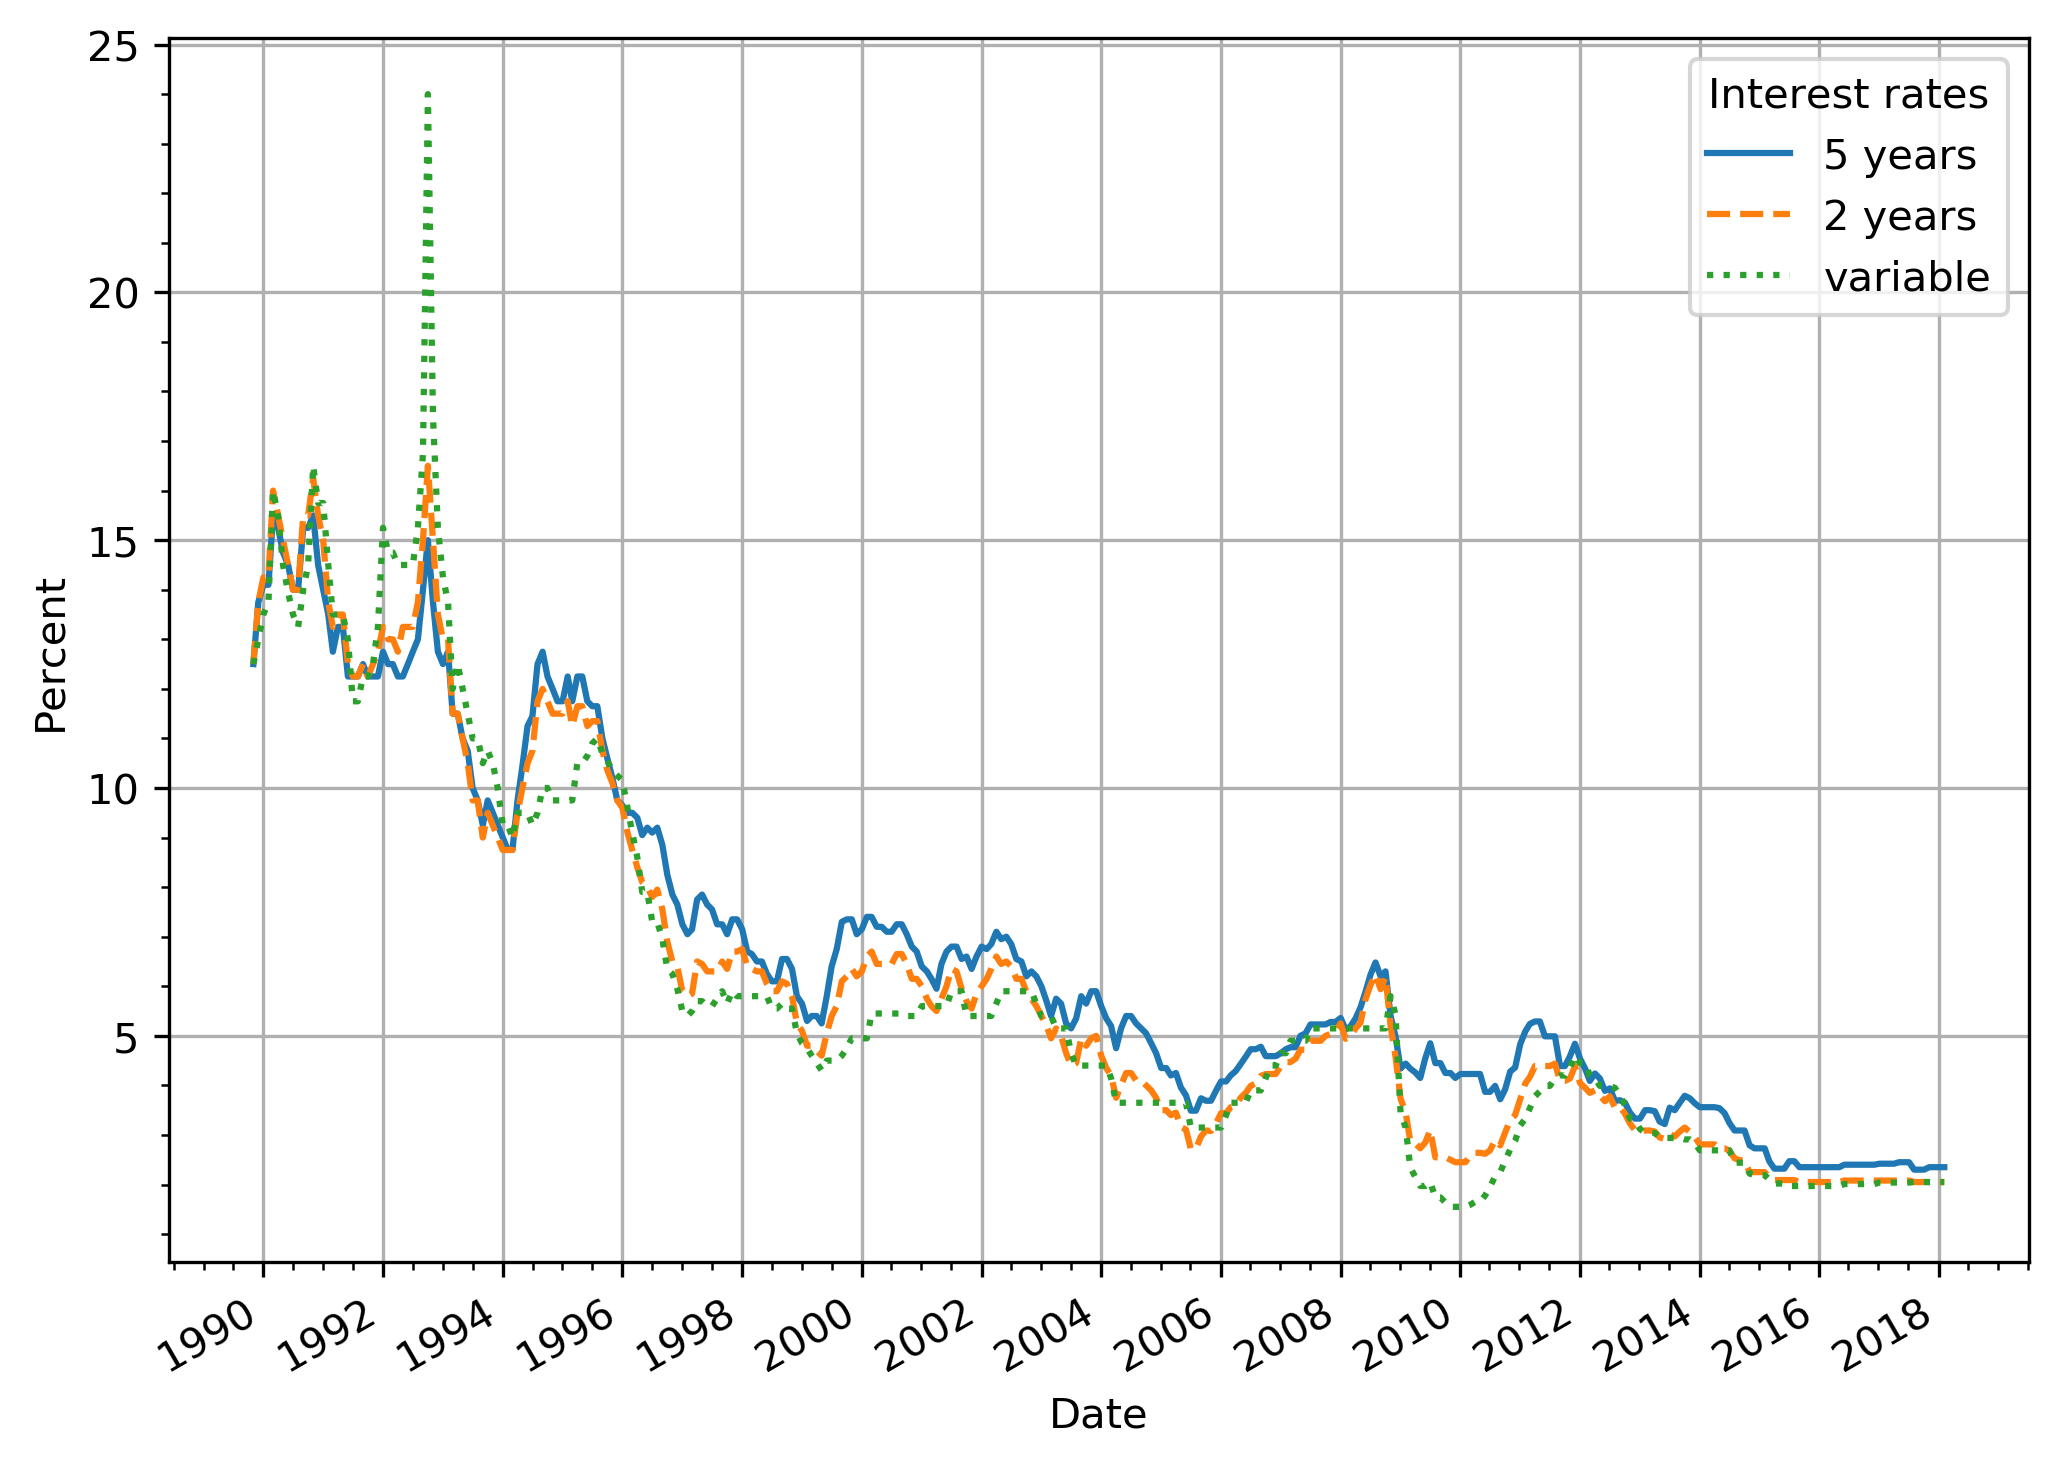
You can see a clear peak in the variable rate when the riksbank set the repo rate at 500% (mortgages “only” reached 24%). You can also see that during the early nineties the variable rate was higher than the fixed rates during relatively long periods. But to compare the actual cost over the fixed term we have to compare average rates.
For example, let us compare the actual average rates from the first of July 1991 during 5 years for variable rate (11.96%) and 5 years fixed term (12.25%). Even though with variable rate you’d have had a rate of 24% during a quarter you’d still pay less in total over the 5 years.
If the same calculation is made for every month you can see how much you would have earned/lost depending on when you started your fixed term. Since 5 years is not evenly divisible by 2 years, the 2 years fixed term refers to what the average rate would have been during the first 5 of the 6 years.
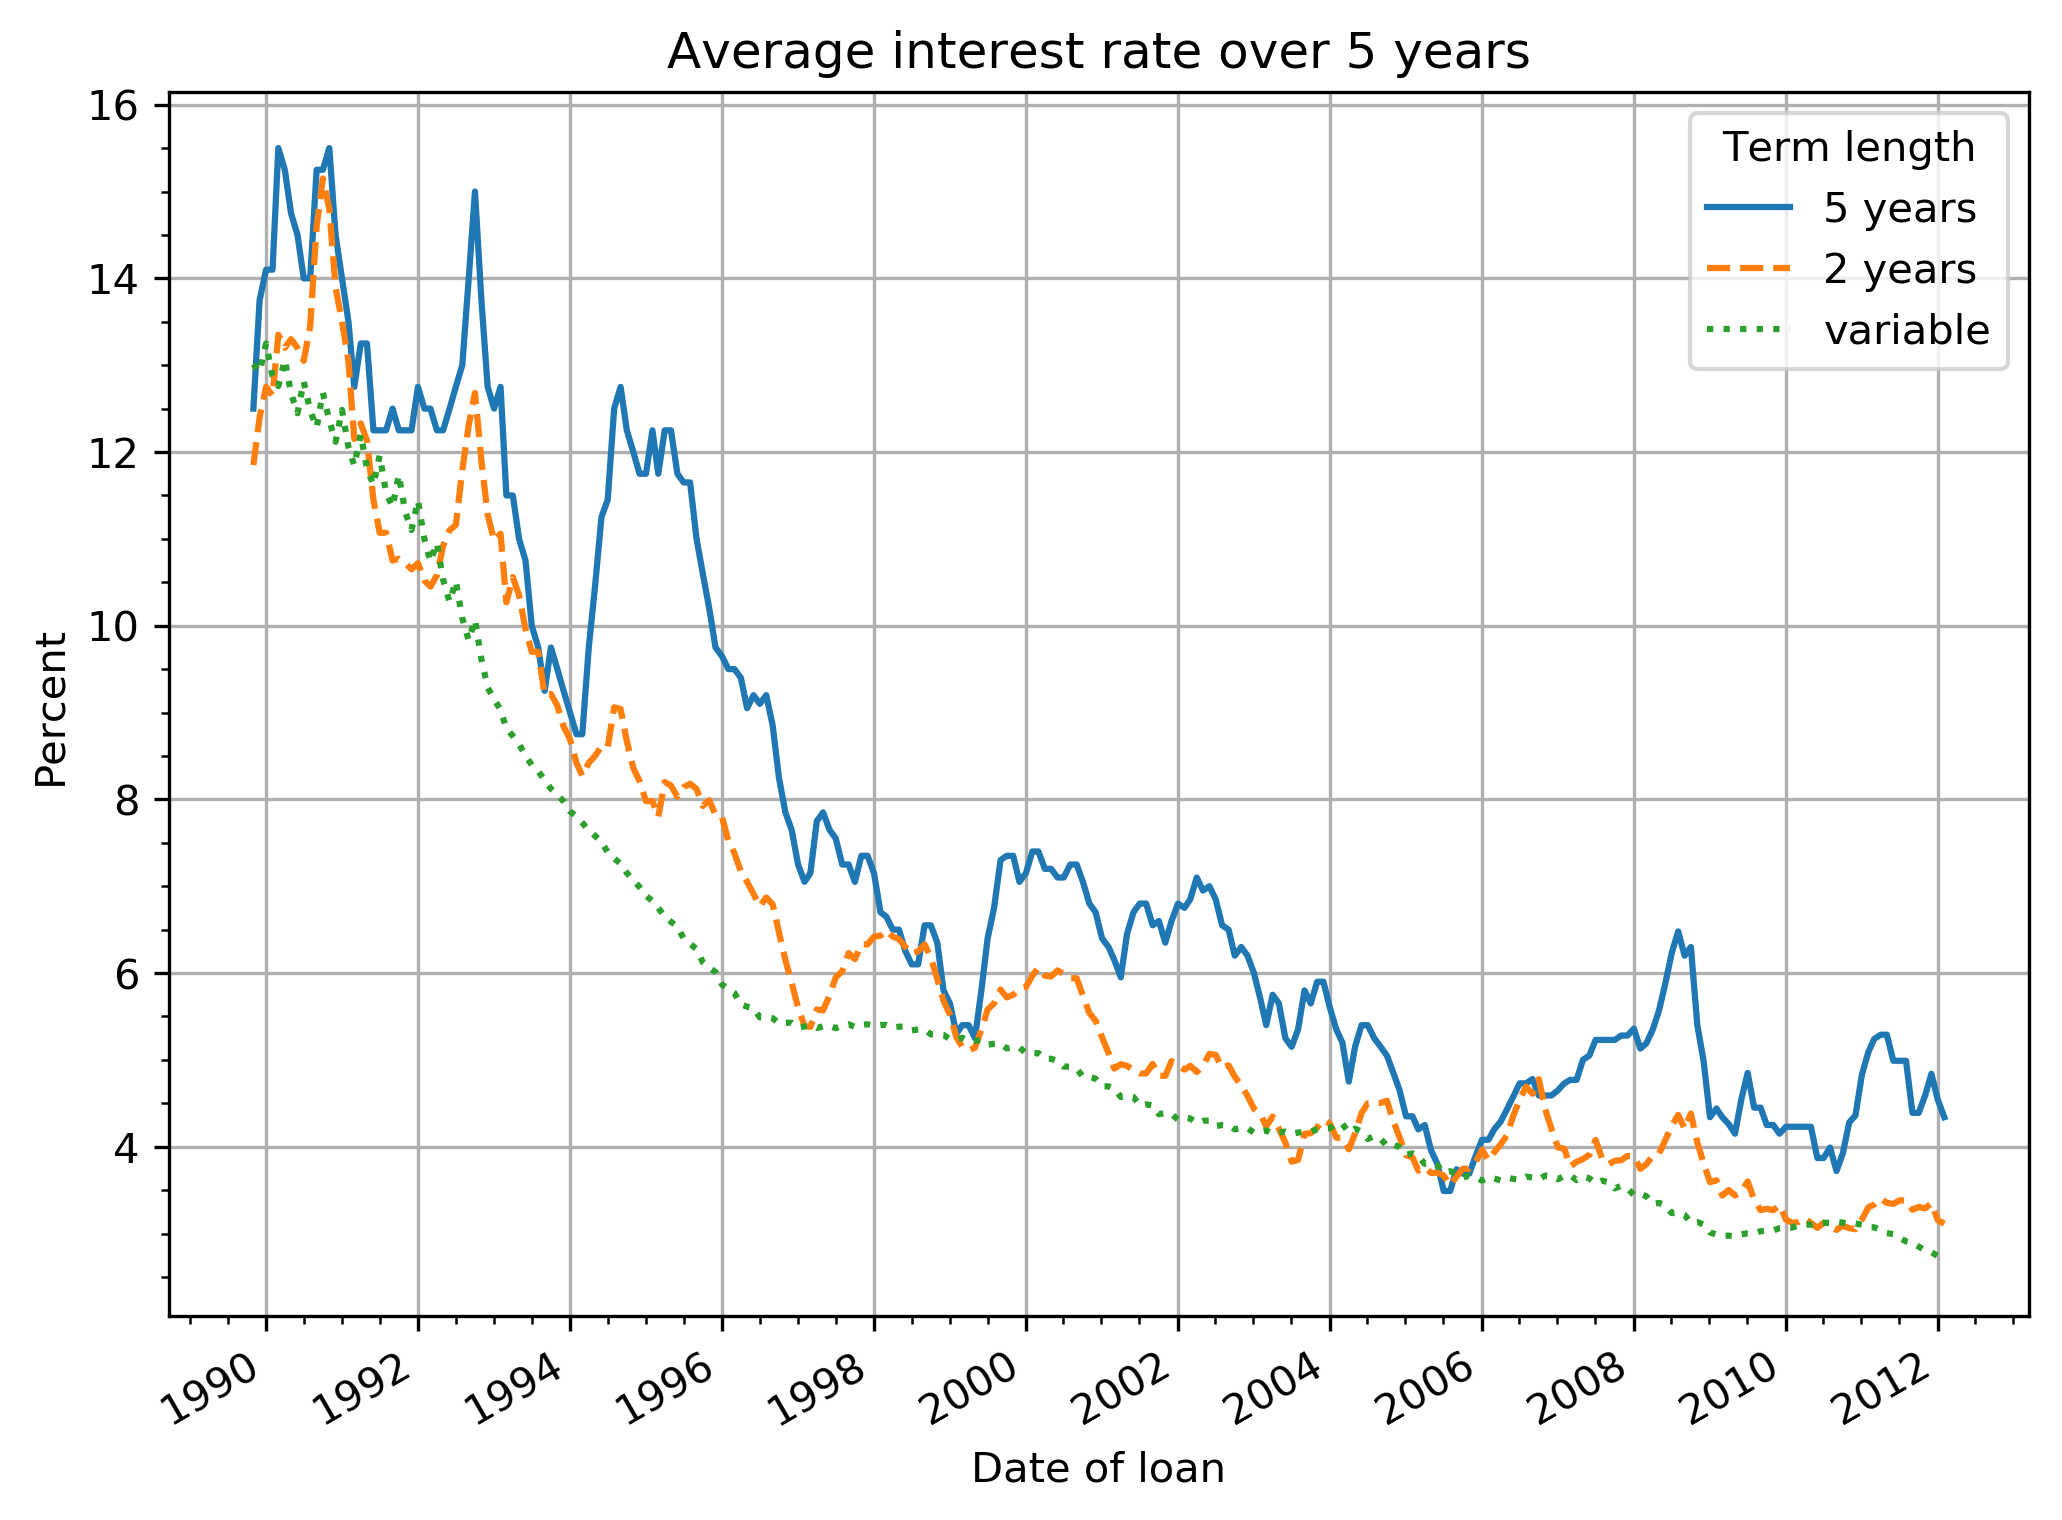
It’s quite clear that variable rate has nearly always been the most profitable alternative. At three seperate occasions it would have been more profitable to pick a 5 year fixed term: at the of 1989, the beginning of 1997, and in the middle of 2005. I won’t comment on the 2 years fixed term since it’s not a fair comparison to only look at 5 out of 6 years.
If we compare 2 years fixed term with variable rate:
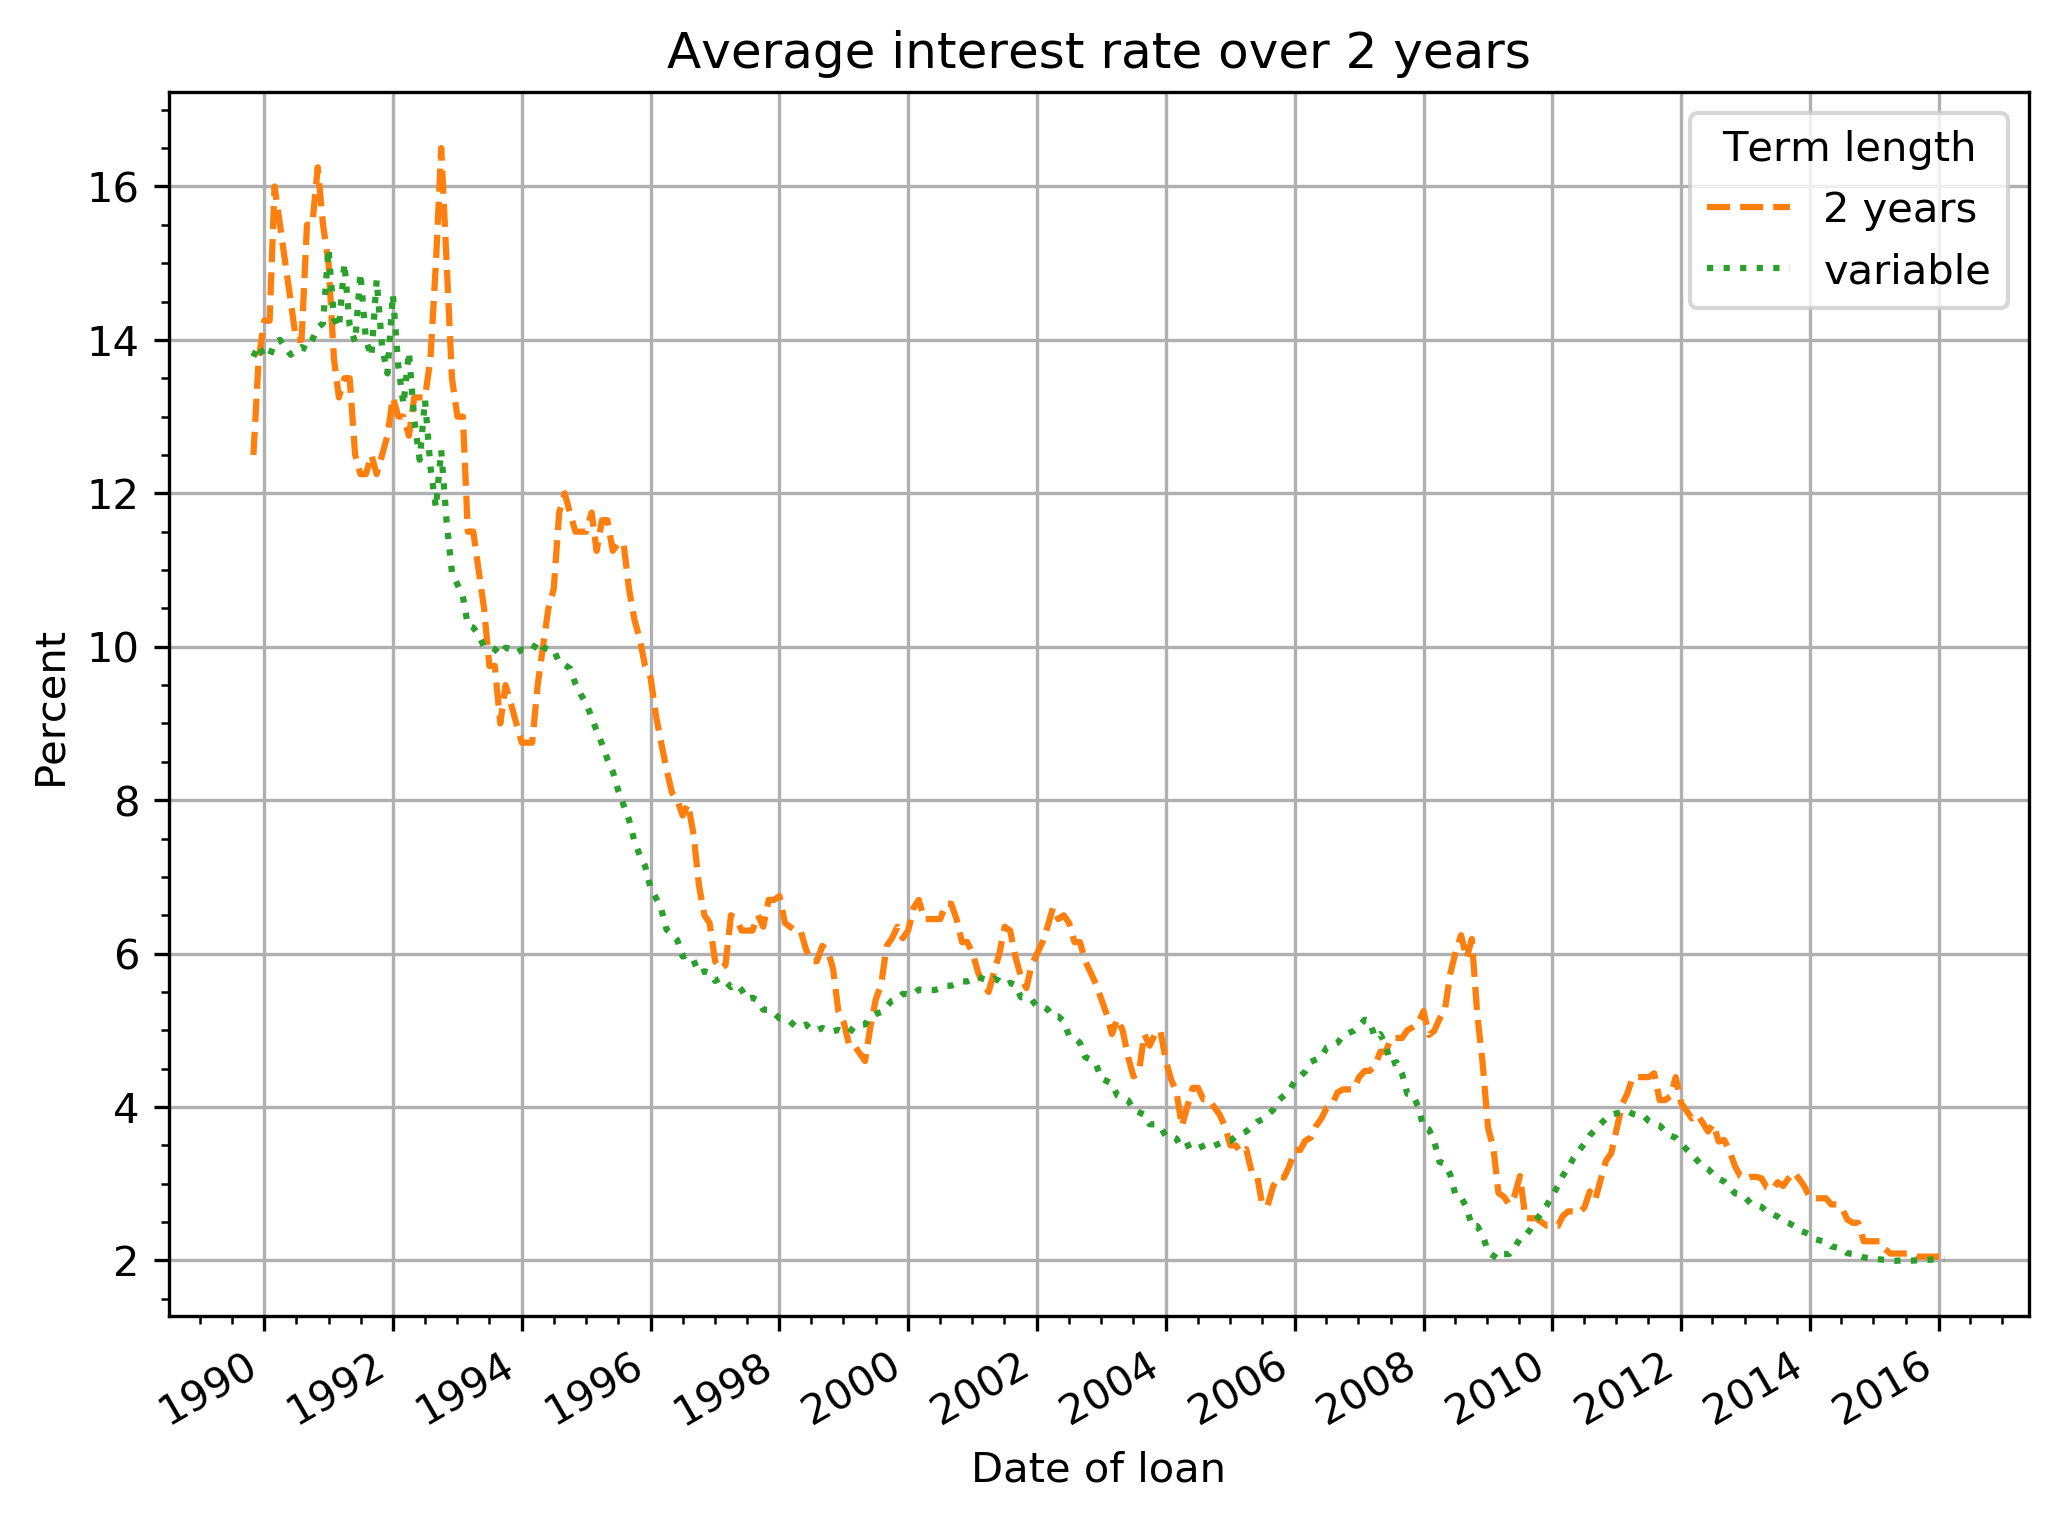
Also here the most profitable choice is generally the variable rate however during times of rising interest rates getting a fixed 2 year term has been the better choice on several occasions. An important difference to the 5 years term is that you’re not locked in for long when the rates finally go down again (and you’re able to switch to variable rate).
If we compare all terms during 10 years:
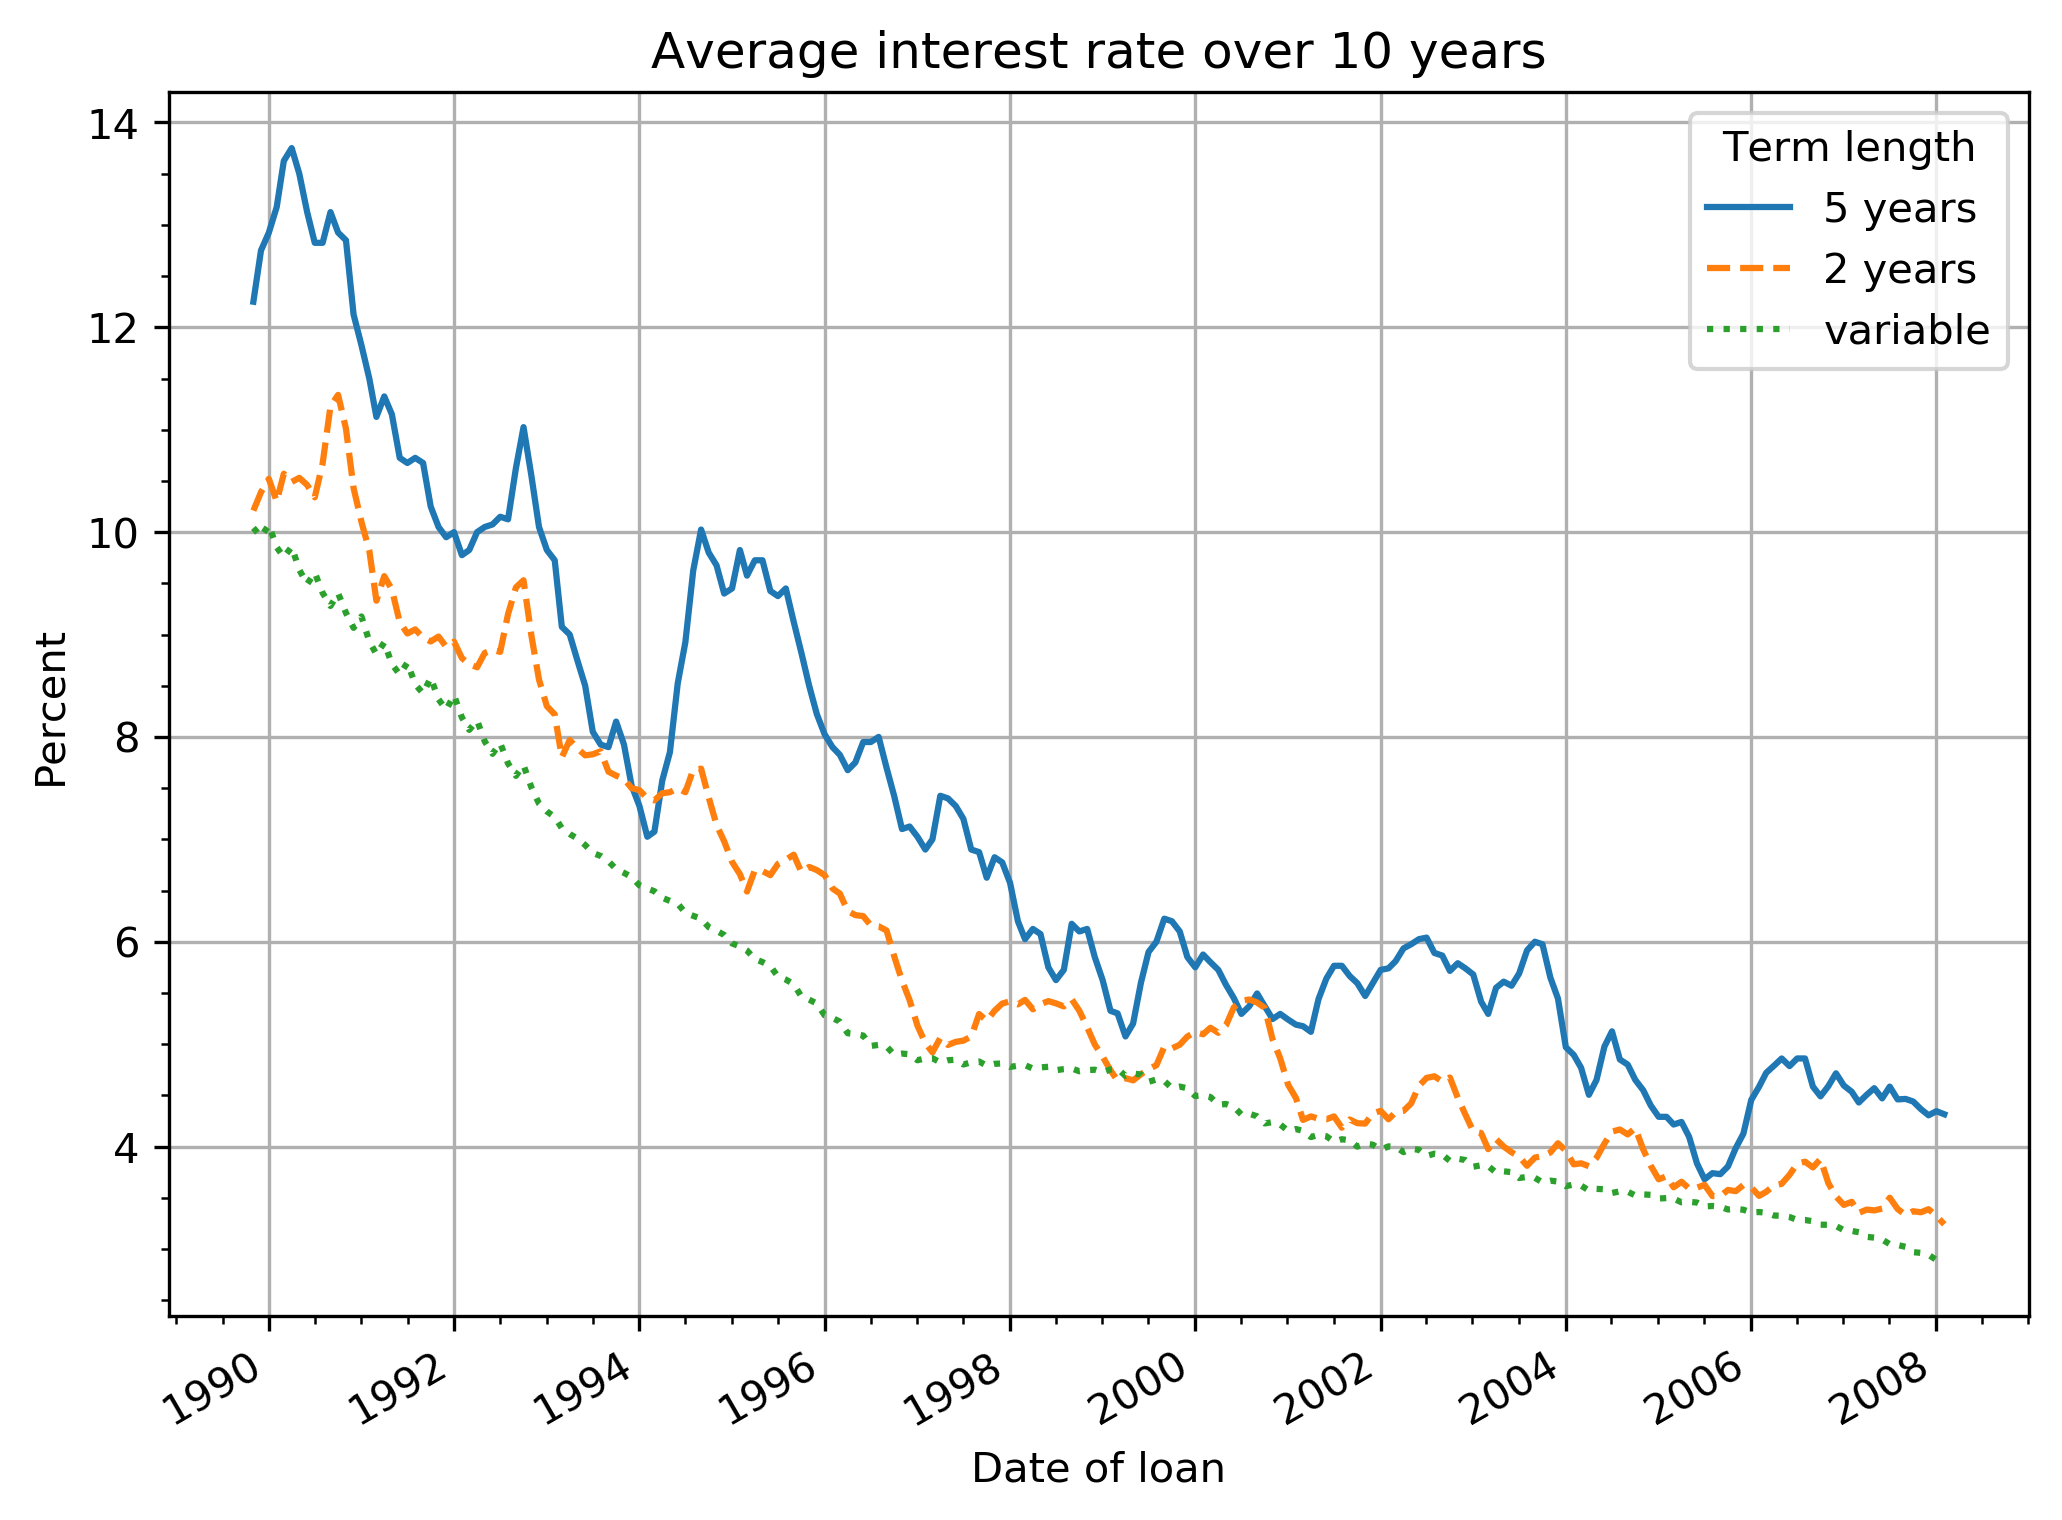
Here it is clear that the variable rate is the most profitable.
Even though it has been possible at certain occasions (29 years and only 3 short occasions!) to get a fixed term for 5 years and pay less overall than with variable rate, I think it’s far too improbable that one is able to do it at the right time. You’re almost guaranteed to be paying more in the end.
Getting a fixed term for 2 years is more probable to be profitable, but even here it is more probable not to be.